Monitoring your websites health with Uptime Kuma
Preface
A month ago I needed to start monitoring the health of dozens of websites. At first I wanted to add this to an existing Zabbix instance (6.x). But I couldn’t find an adapter that suited my situation. It comes with 7.x versions or I need to rebuild Zabbix with the support features I need.
So I tried to find something that could be quickly deployed using Docker, with minimal setup, and easy to host on an existing VPS.
I don’t want to use free online services because they always have limitations and eventually you have to pay.
After poking around on github, I found a great thing that looks great, and has enough of a community to keep it alive for the next few years. It’s Uptime Kuma.
https://github.com/louislam/uptime-kuma
Kuma is Japanese for bear, right? Anyway, I installed it in a few minutes and had a working interface. It’s been running for over a week now, and looks good on desktop and iPhone. It doesn’t have a lot of options, but it does what I need it to do - check if the site is up and running, and show a short history in the UI.
Install with Docker
For install on linux/mac with docker (or docker-ce ) enough this:
docker run -d --restart=always -p 3001:3001 -v uptime-kuma:/app/data --name uptime-kuma louislam/uptime-kuma:1
Next need to go to start page and register admin account:
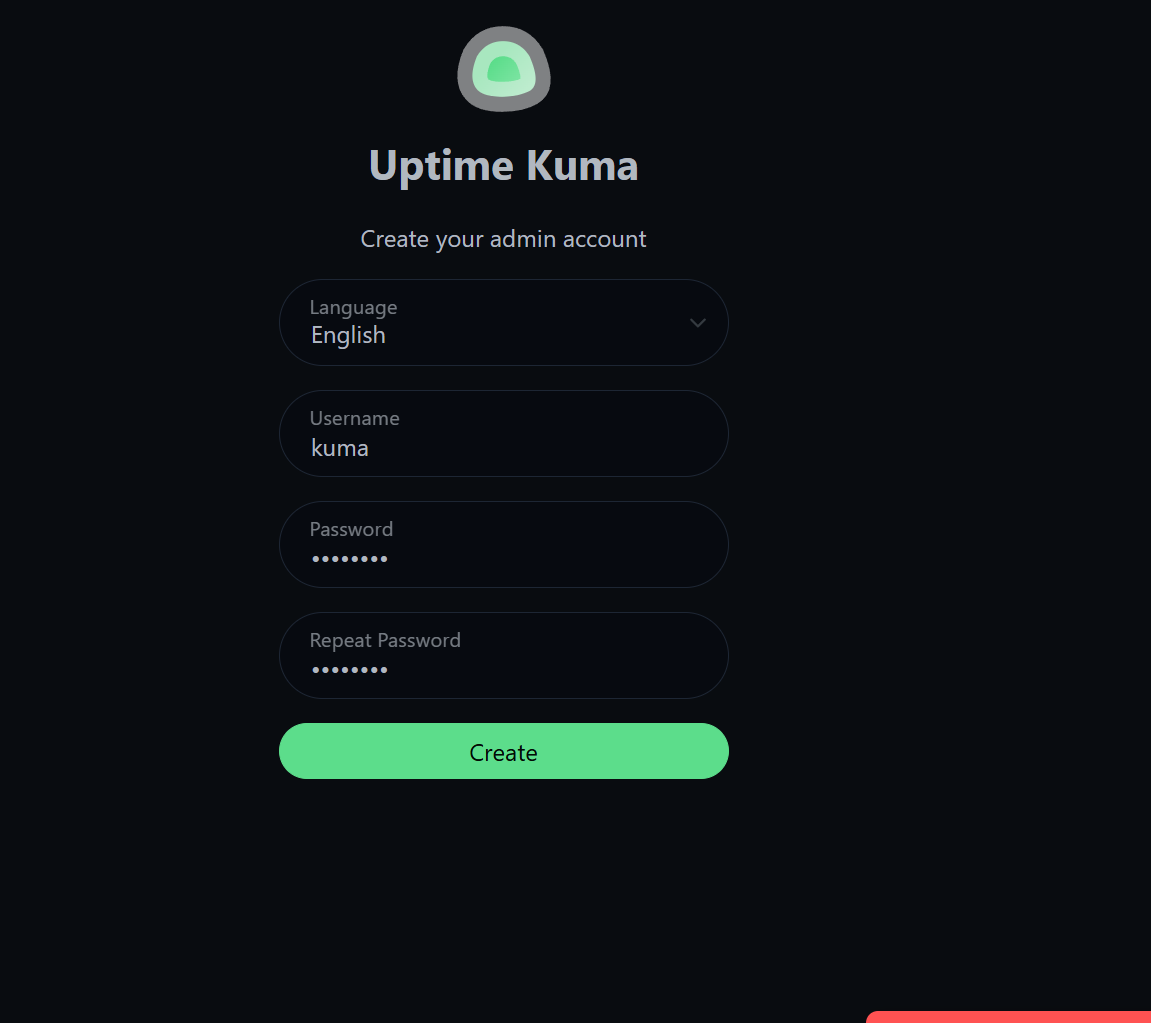
It have password restrictions:

Usage
Here is interface, simple and easy)
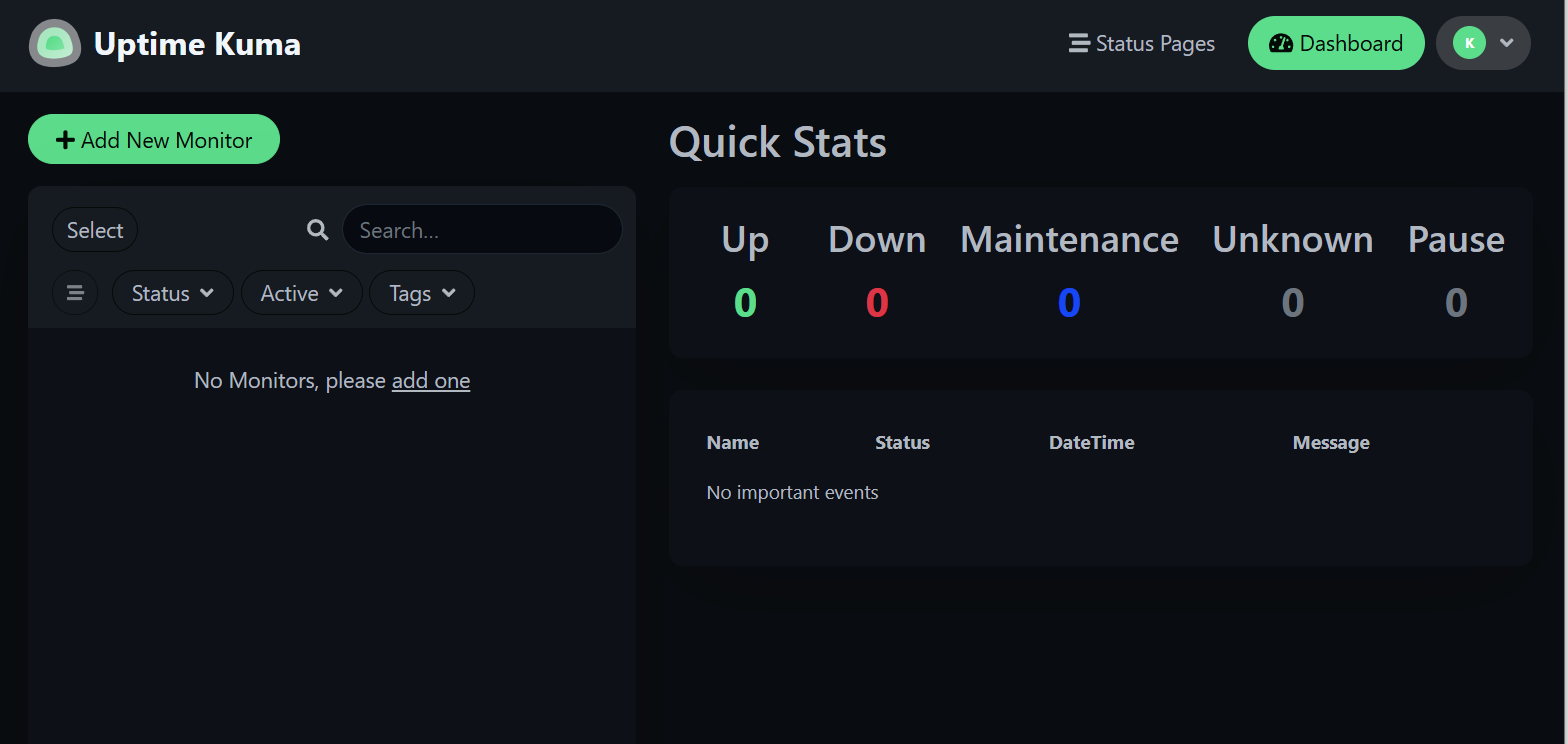
Add new monitor = Add new website for monitoring.
Of course you can monitor API service, or something like this.
Im my case it will be just web sites:
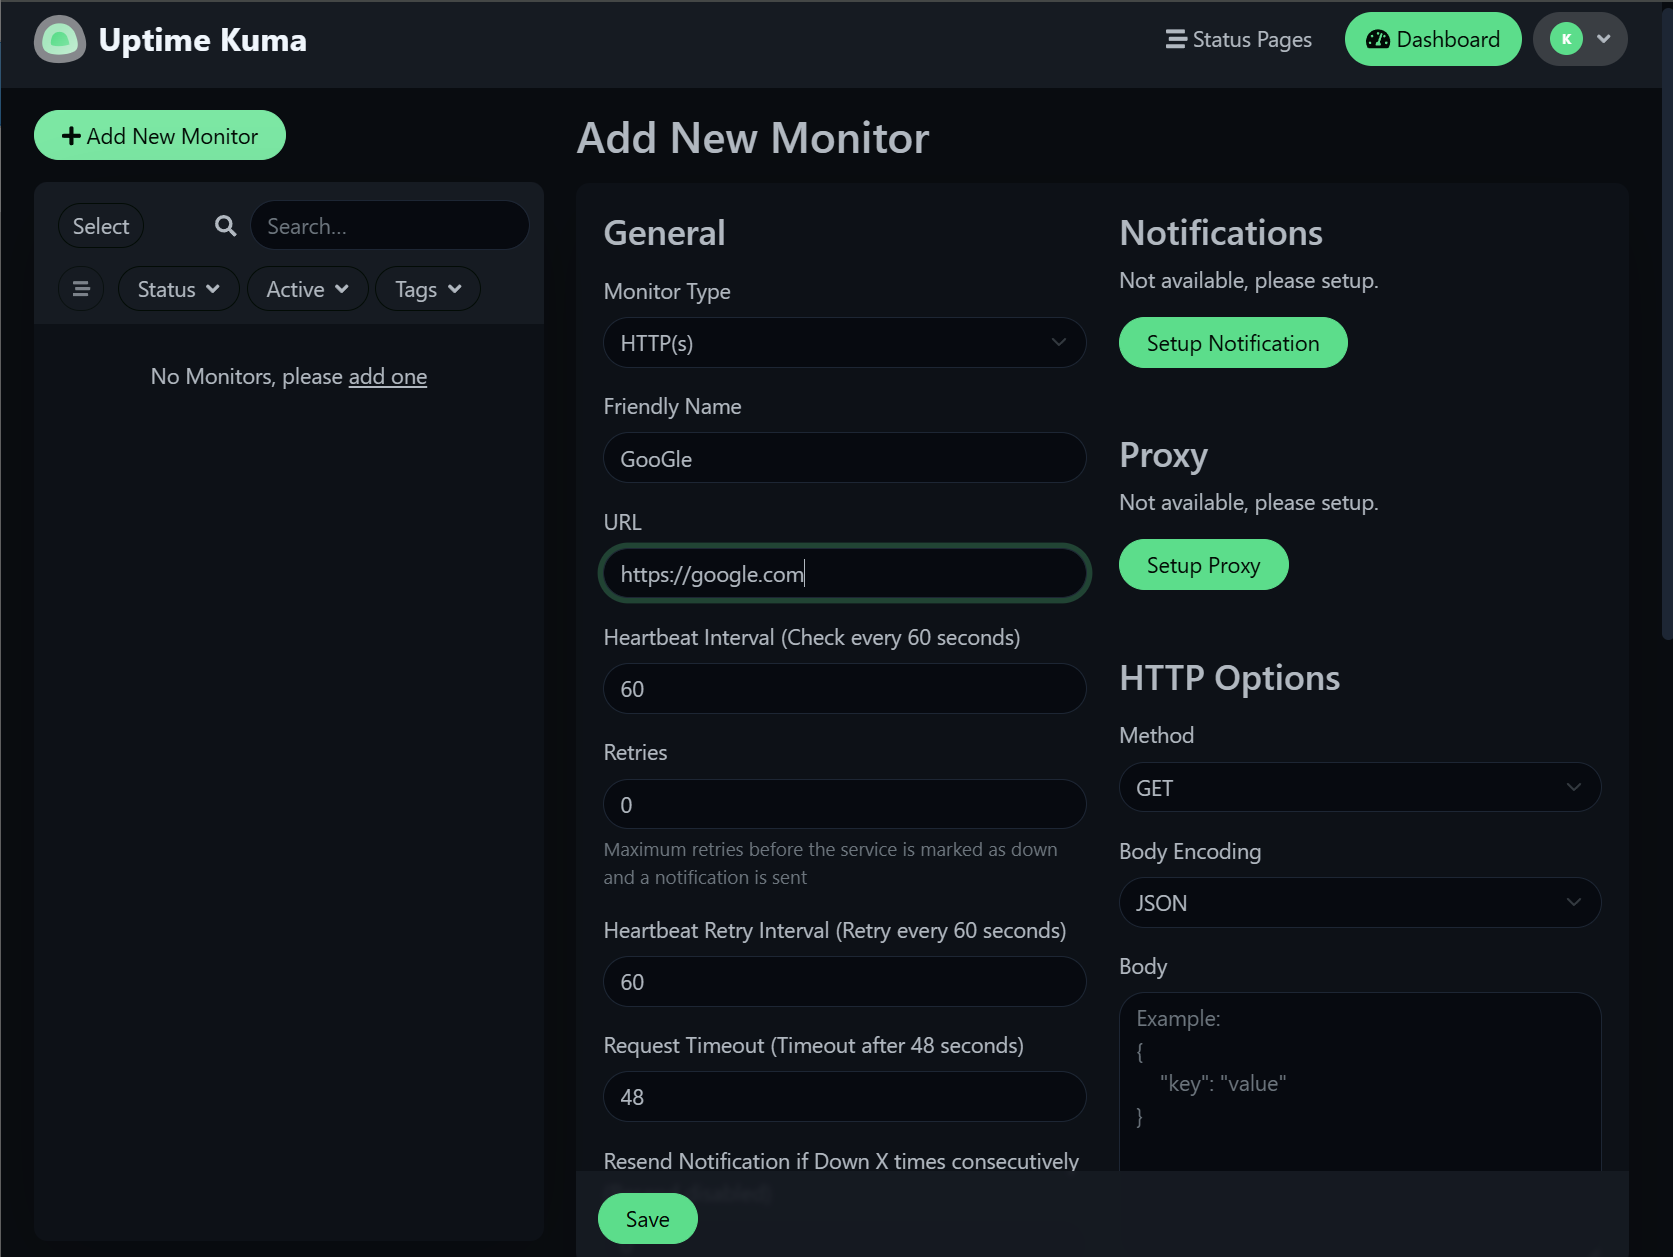
You can set custom settings such as heartbeat interval, retries, special methods (GET/POST/etc.).
Page of each monitored endpoint have short but useful overview:
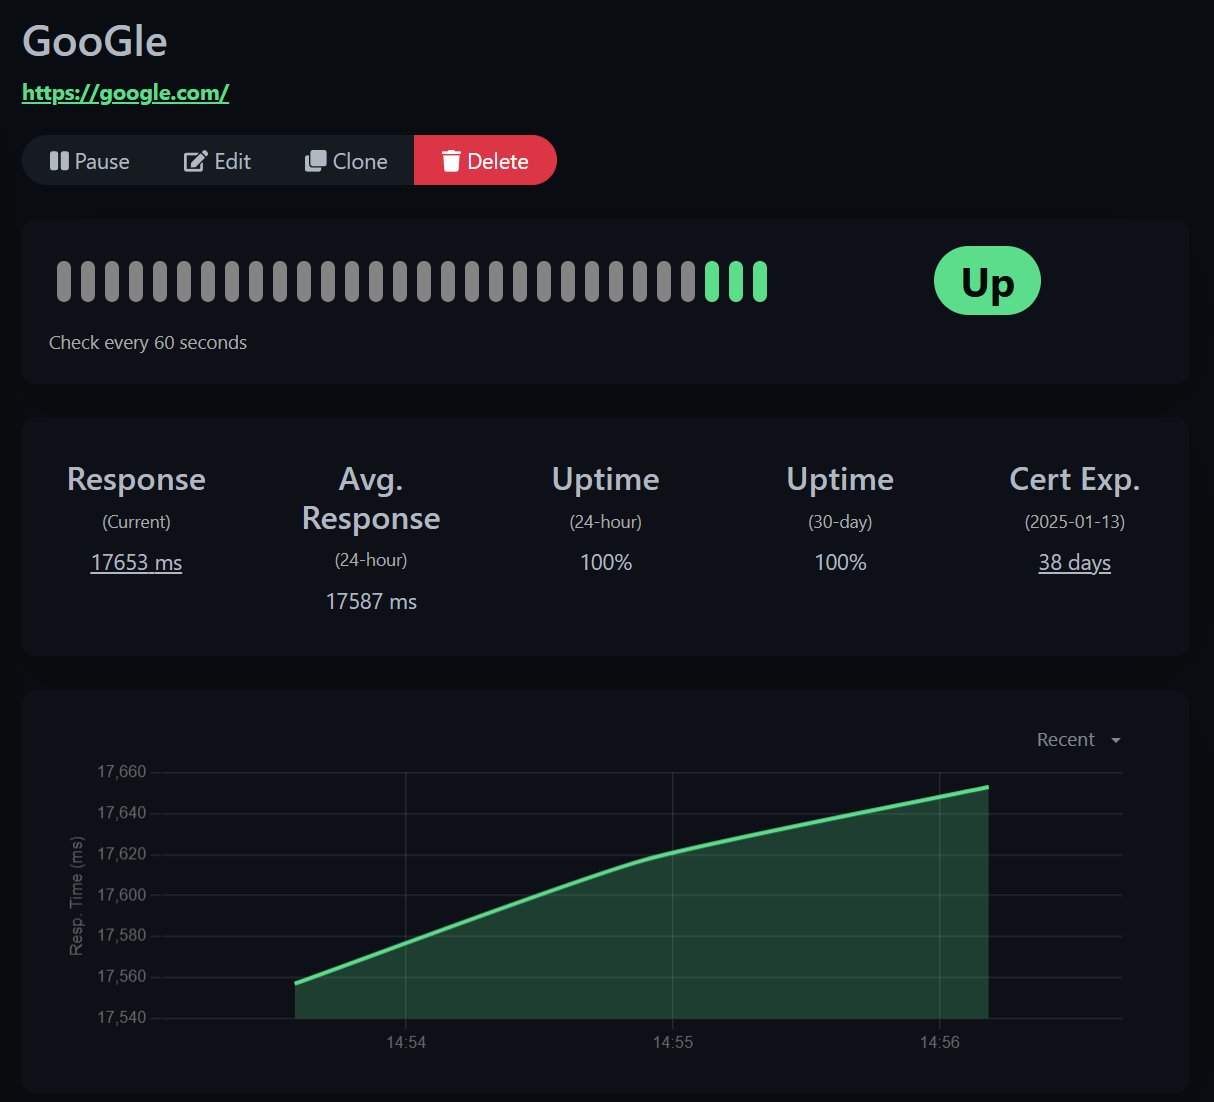
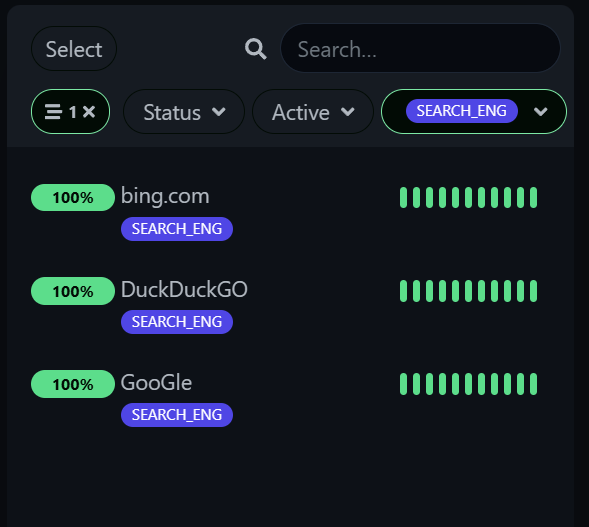
Fast search by hosts, structuring by tags.
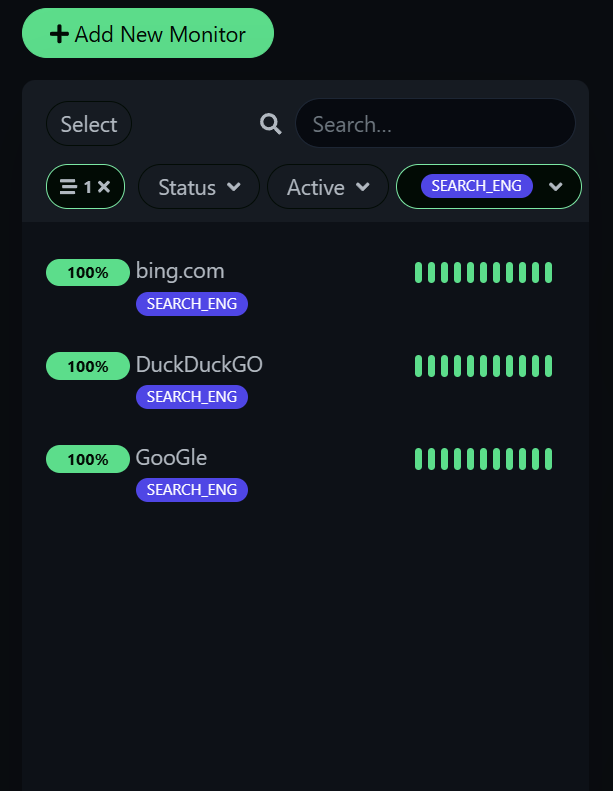
Filter by tags
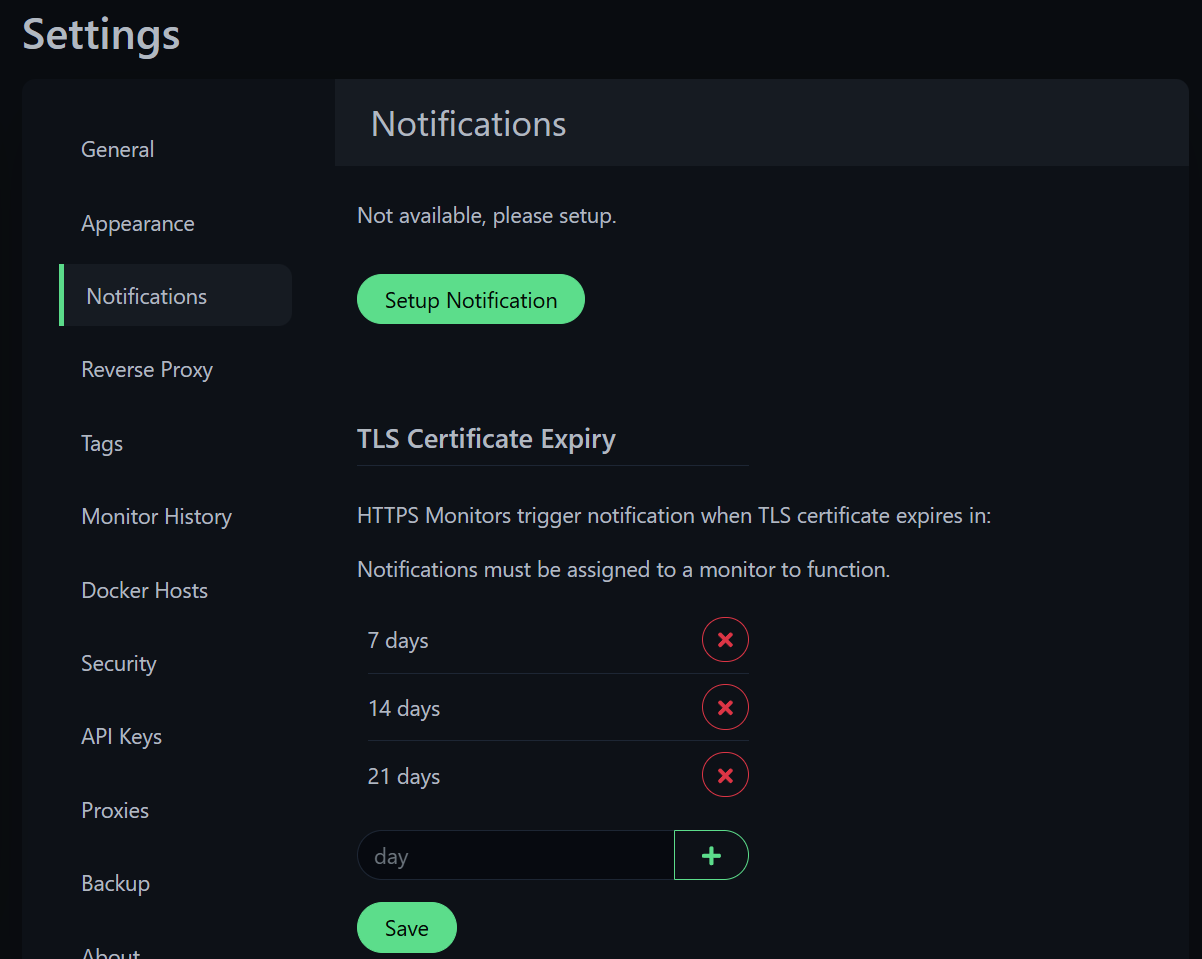
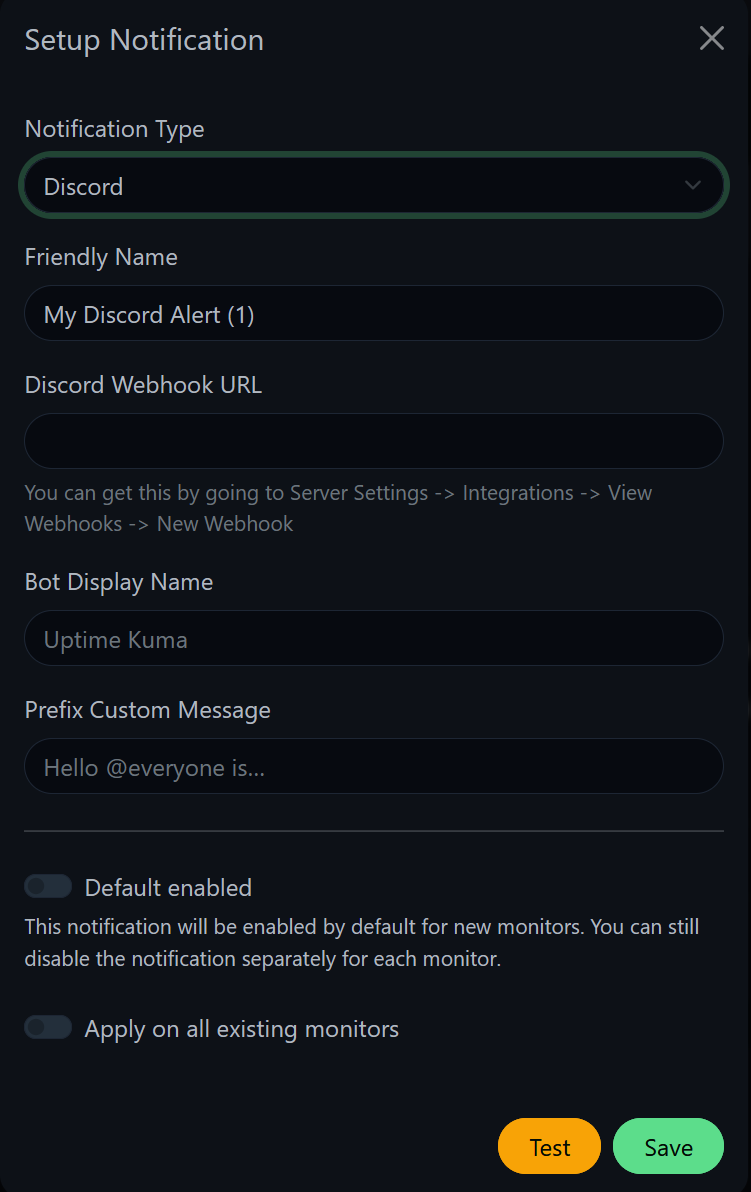
And notifications! A very large list of supported platforms (SMTP, Discord, Telegram, etc.).
Here’s a modest tool. It covers my needs in this case. Of course, for statistics/analytics with a large time range, it’s better to use more mature things like zabbix or Nagios, but if you have about 10 instances, you can’t spend so much time on it.